Getting Started with Table Extraction in Document AI
Table extraction fall under the umbrella of Document Intelligence, a relatively new research topic that deals with analzying and understanding business documents. The documents vary in style, layouts, fonts and generally have a complex template. Since digitisation of documents is a recent phenonmenon, majority of such documents are scanned copies of their printed counterparts. The poor quality of images, skew arising due to scans made in haste compound the difficulty of the problem. Especially in the financial domain, where the significance of every number and alphabet is paramount. Manual supervision along with some software aid is the current norm, however each day, efforts are made to reduce the amount of interventions required by humans. Extracting tables from these documents is one such sub domain, which has attracted a lot of researchers. Tables do not have a specified way of being constructed, and often the artistic proclivities involved in making tables look more presentable, add a layer to the difficulty of the problem. Most of the information in tables would make sense, if the relationships and contexts are known prior, as tables generally contain limited data. I will attempt to give an intuition behind some of the work being carried out in this area, and hopefully spark enough interest in anyone reading this, to delve deeper in the field.
Popular Datasets
Some popular datasets that have been curated over the last few years in order to facilitate testing and training of Document AI tasks and will be used in this post are briefly described here. The disparity in the number of samples across datasets depends on whether the entire dataset was manually curated or generated automatically in a semi-supervised fashion.
| Dataset Name | Number of Samples | Document categories covered |
|---|---|---|
| IIT-CDIP (Illinois Institute of Technology Complex Document Information Processing Test Collection) | Made from over 6 Million Scanned documents | Spans all kinds of documents |
| RVL-CDIP (Ryerson Vision Lab Complex Document Information Processing) | 400K grayscale images (320K training, 40K validation, and 40K test images) | Subset of IIT-CDIP |
| SROIE (Scanned Receipt OCR and Information Extraction) | 1000 | Scanned Receipts |
| FUNSD (Form Understanding in Noisy Scanned Documents) | 199 fully annotated forms, 31485 words, 9707 semantic entities, 5304 relations Samples | Exclusively contains forms in scanned documents |
| CORD (COVID-19 Open Research Dataset) | Curated from 500K scholarly articles | Articles about COVID-19, SARS-CoV-2, and related coronaviruses |
| Kleister NDA | 540 NDAs, 3299 unique pages | Scanned and born-digital long formal Non Disclosure Agreements |
| Doc VQA | 12767 Document Images | Industrial documents including typewritten, printed, handwritten and born-digital text |
| PubLayNet | made from over 1 million PDF articles | Scientific articles and reports in the medical domain |
| PRImA (Pattern Recognition and Image Analysis) Layout Anaylsis Dataset | 305 ground-truthed images | Magazines and techinical articles spanning multiple domains |
| Table Bank | 417,234 high quality labeled tables | Tables extracted from LaTeX and Word documents |
| HJ Historical Japanese Dataset | Over 250,000 layout element annotations of seven types | Complex layouts from all kinds of historical documents |
Initial Approaches
-
The first efforts to compartmentalize a report into tabular and non tabular areas were made in 2016, where existing object detection architectures (CNNs, R - CNNs and their variants) were trained to detect tables in pdfs.
-
In 2018, an end to end framwework was recommended in order to extract semantic structures of tables and paragraphs from documents. Pretrained word embeddings were in a fully conventional network to get decent results.
-
In 2019, a Graph Convolutional Network was proposed, which combined visual and textual cues from a document for achieving the same result of identifying semantic structures.
Layout LM
Almost every iteration brought with itself promising results, and had scope of application in real world datasets, However 2 aspects which the inital approaches hadn’t tried, and was first explored by LayoutLM (Xu et al, 2020) were
- Avoiding reliance on labelled data, since the number of such publicly known datasets were limited
- Trying joint pretrained models taking both textual and layout information into account. Up until now, the pretrained models were either CV or NLP models.
Proposed by a team at Microsoft Research Asia, LayoutLM constituted a novel approach to simply pretraining for document AI tasks, and recommended fine tuning for subsequent tasks as per need. LayoutLM extends the core idea used in BERT to gain better performance in document AI tasks.
Modifications made to the BERT pretraining stage:
- Along with the word embeddings, embeddings to leverage the visual layout information present in the documents were added.
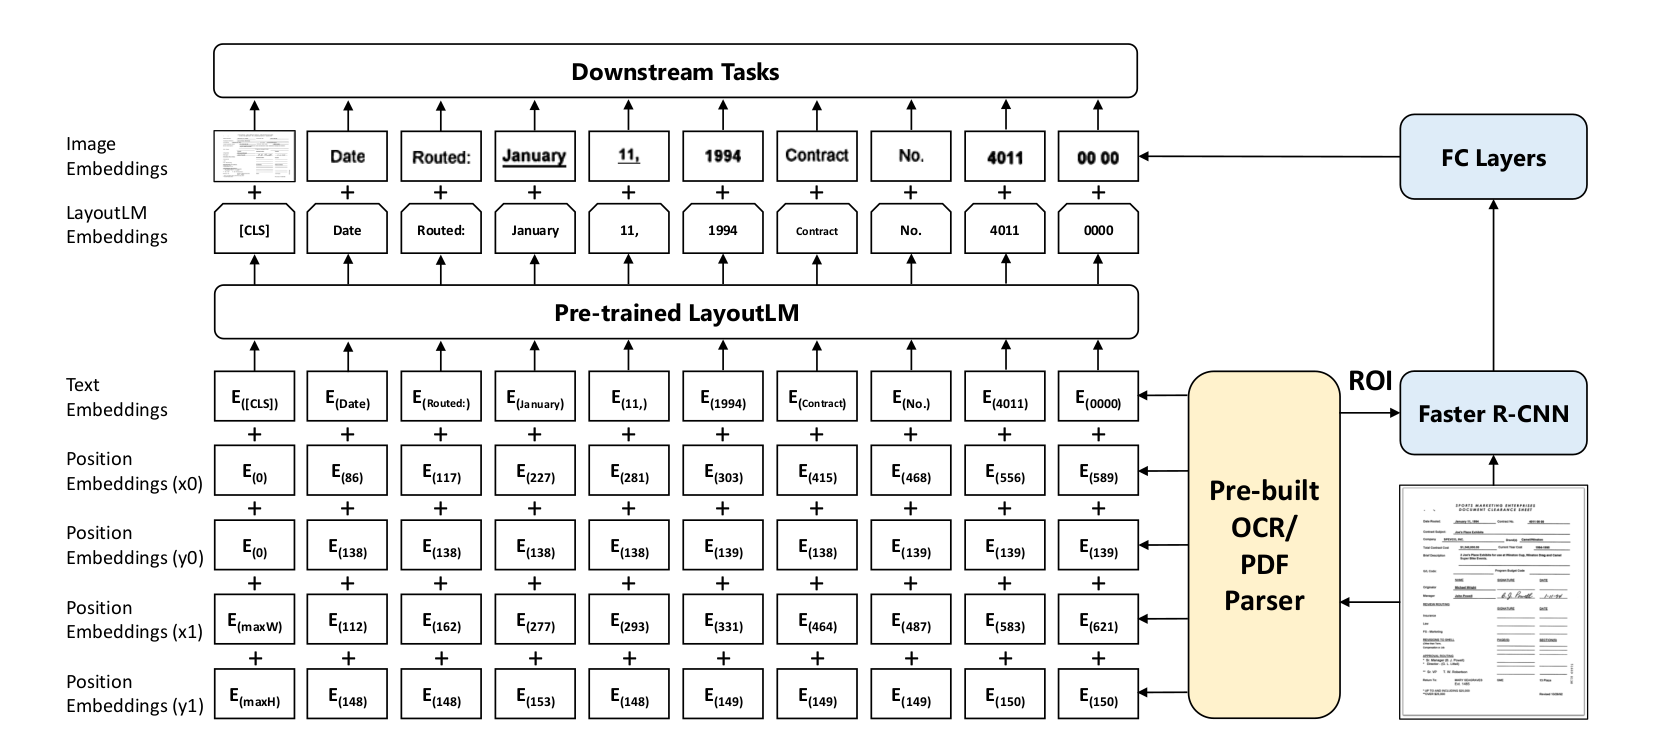
- 2d Position Embedding: The top left corner of the document page is considered to be the origin, and the bounding box for the word in the resulting coordinate system is stored as (x0, y0, x1, y1), with x0, y0 representing the upper left, and (x1, y1) representing the bottom right corner respectively. This helps model sparsity of the current word in the page, vicinity to other words, size of the current word relative to others and other spatial features, that would otherwise not be stored in case of traditional word embeddings.
- Image Embedding:
- Word Image Embedding: These image embeddings are generated by a faster R-CNN, which is fed the document image and the Region of Interest is specified by an OCR system that gives the bounding box results of the word in question.
- [CLS] token Image Embedding: Using the same faster R-CNN, embedding of the entire document image is generated the Region of Interest set as the entire page. This is generated to assist in the downstream fine tuning tasks.
-
The pretraining task of Masked Language Modelling(MLM) changed to Masked Visual Language Model(MVLM). Just as 15% of the text tokens were masked in the original task. Here, word embedding is masked but the 2d Positional embeddings are retained, thereby utilizing language contexts in conjunction with spatial information to predict the masked token.
- The pretraining task of Next Sentence Prediction (NSP) changed to Multi Label Document Classification (MDC). This change was made to encapsulate the knowledge from different document domains and thus generate better document level representations.
LayoutLM Fine tuning:
The fine tuning stage in LayoutLM is virtually identical that of BERT, differing only in the 3 downstream tasks were carried out viz. Form understanding using the FUNSD dataset, receipt information extraction using the SROIE dataset, and finally document classification on the RVL-CDIP dataset. The exact hyperparameters for each of the tasks differ and can be found in the paper. The overall idea of fine tuning is still the same, however slight improvements to all of these tasks as well as on other document AI tasks are constantly being made.
Sample Pipeline:
The document image is fed into the OCR system, which in turn generates the bounding boxes of each individual word in the page. Each coordinate x0, x1, y0, y1 along with the actual text are converted into a embedding vector, which in turn is concatenated. These embeddings are used to get pretrained LayoutLM embeddings. Parallely, the bounding boxes of each individual word along with the original document image is also fed into a faster RCNN, which generates the image embeddings. The image embedding and the pretrained LayoutLM embedding are combined and used for all downstream tasks.
Layout LM v2
Research continued in 2 distinct directions in the case of document AI. The first continued with the initial approaches and tried to combine various NLP and CV individually pretrained models combining the outputs in a shallow manner. Although these methods invariably have state of the art performances on several datasets, there are a few key problems with continuing in this fashion. Such methods end up not performing well in case the document type is changed (from receipt understanding to form understanding) or in case the underlying domain is changed (medical documents to financial documents). This results in constant rework to adapt to every domain. The other approach of going about document AI tasks was the one introduced in LayoutLM, where the visual and text components are combined together to generate a unified pretrained model, and as per the task at hand, fine tuning is carried out with minimal effort. LayoutLM v2 (Xu et al, 2021) quite evidently chose the second route, fruther improving upon the ideas from the previous iteration. Although the number of fine tuning tasks on the which the results of the improved pretrained model were shown were also increased, the more significant changes were made in the pretraining stages.
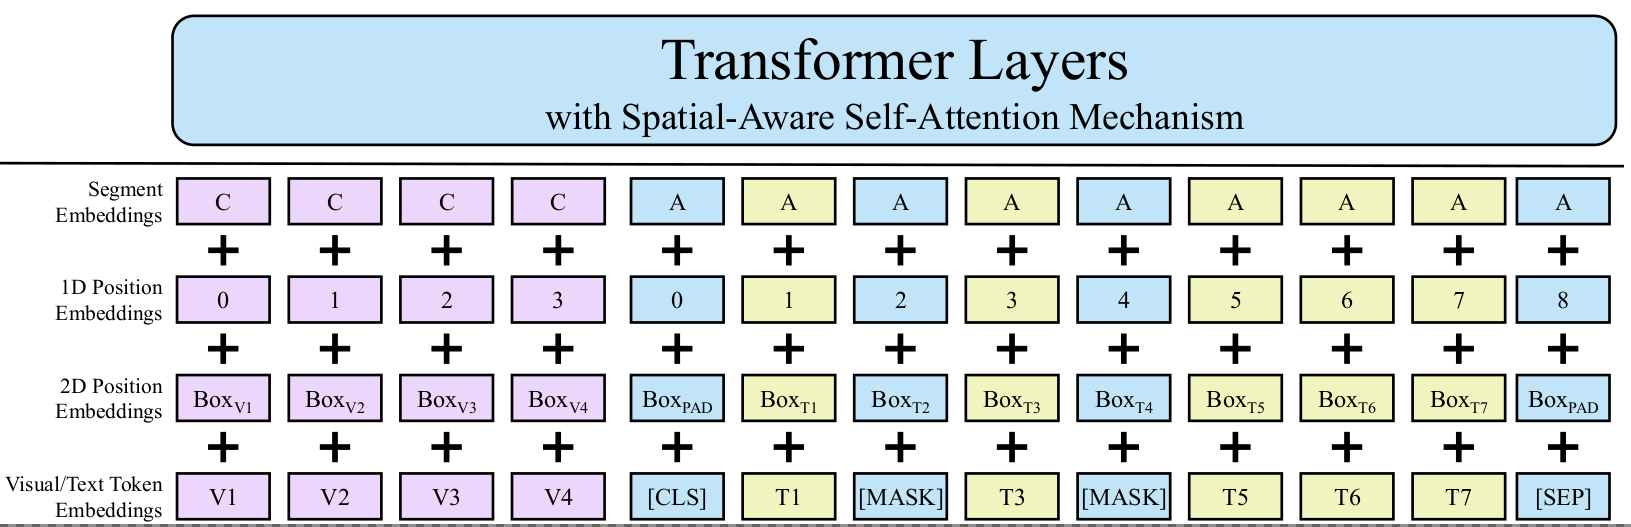
- Pretraining Embeddings: Unline LayoutLM, where image and text embeddings were added in the finetuning stages, in the new iteration, the image information is encoded in the pretraining itself. To account for the changes, the embeddings are divided into the following categories
- Text Embedding: To encapsulate the textual meaning, the text is initially separated into segments of
Ltokens each. In case, some tokens are smaller in lenghts,[PAD]tokens are used to fill out the gaps.[CLS]and[END]tokens are present to denote the start and the end of the text sequence in each segment. The final embedding per token however has a few extra information encoded.- Token Position embedding (PosEmb1D): Generated based on the position of the token in the segment
- Segment embedding (SegEmb): Generated based on the position of the segment amongst all the ones in the page
- Token embedding (TokEmb): The text embedding as done in LayoutLM
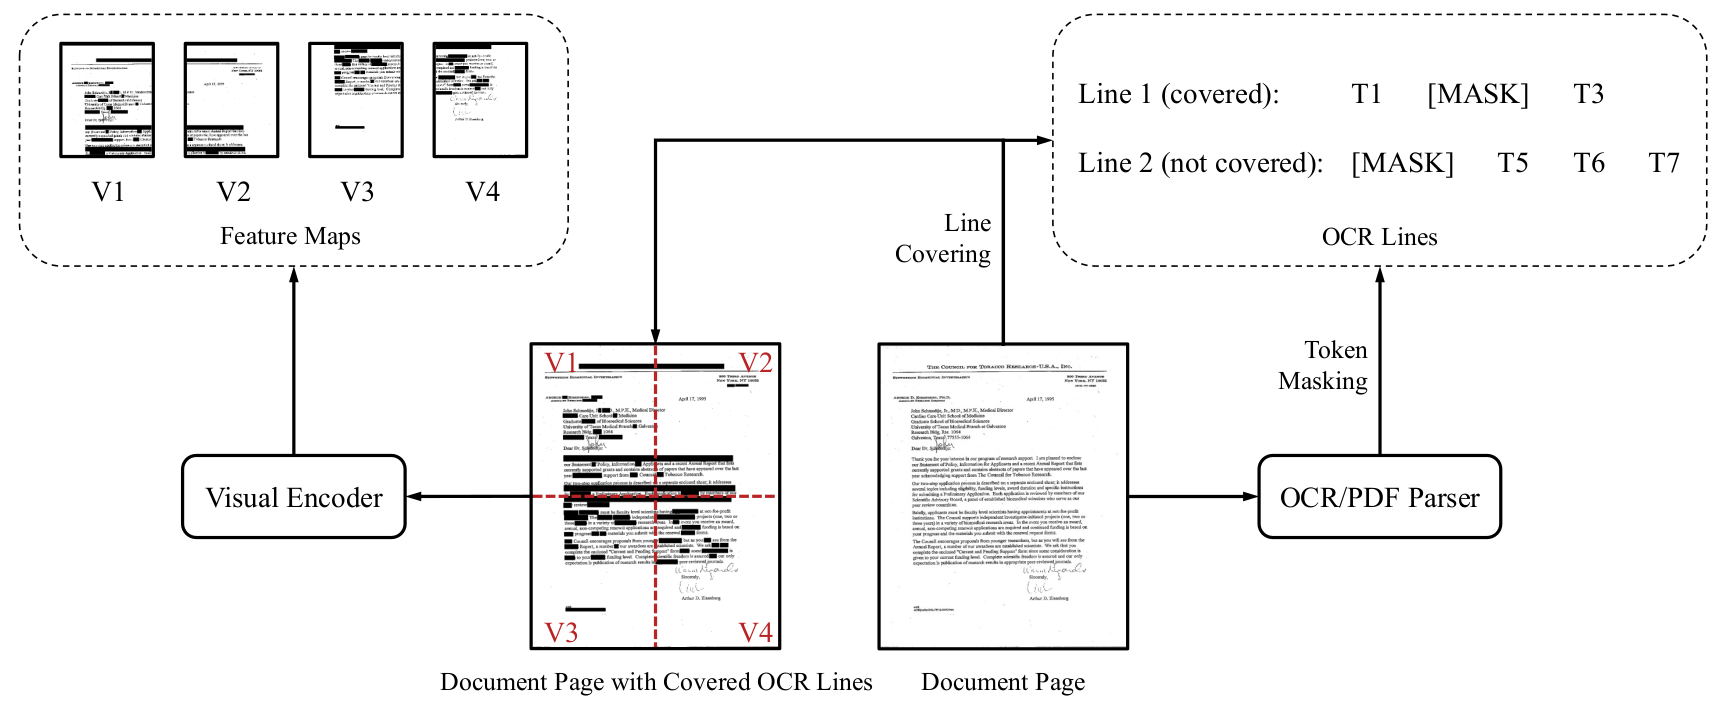
- Visual Embedding: Visual information needs to be embedded to encapsulate information about font styles, text alignments, skew etc.
- Resize document image to
224 X 224 - Feed resized image into the encoder architecture. The ResNeXt-FPN architecture is used as a backbone
- Average pool, the feature map output from the encoder to to get a fixed
W X Hsize - Flatten the output to get a
W Hsize - Each element in the resulting vector is projected linearly, to get the visual token embedding
- To maintain conformity with the textual embeddings, all the visual tokens (each element of the
W Hvector) are assigned the same segment[C]. - Similar to textual embeddings, each element in the vector, also has a corresponding 1 D positional embedding.
- Resize document image to
- Layout Embedding: Layout information becomes critical to embed spatial information and is similar to the 2D positional embeddings done for LayoutLM. The encapsulated knowledge here is critical, since in most cases of complex tables, the grammar won’t make sense, unless the text’s position in a table is known apriori. The layout embedding is generated for both visual and text tokens by discretizing and normalzing the bounding boxes of these tokens.
- Text Embedding: To encapsulate the textual meaning, the text is initially separated into segments of
- Spatial Aware Attention Mechanism: The textual embeddings (
T), and the visual embeddings (V) are concatenated into a single vector. The resulting vector is added to the layout embedding vector (L). The resulting sequence (X) is fed into the transformer style architecture of BERT and LayoutLM. However, owing to the mulit modal input embeddings, absolute positional embeddings aren’t modelled. The whole purpose of trying to model the local invariance in the document would fail in case standard attention mechanism is used in conjunction with relative positional embeddings. Therefore, the standard attention mechanism is equipped with 3 different bias terms to denote the learnable 1D and 2D biases along X and Y directions.
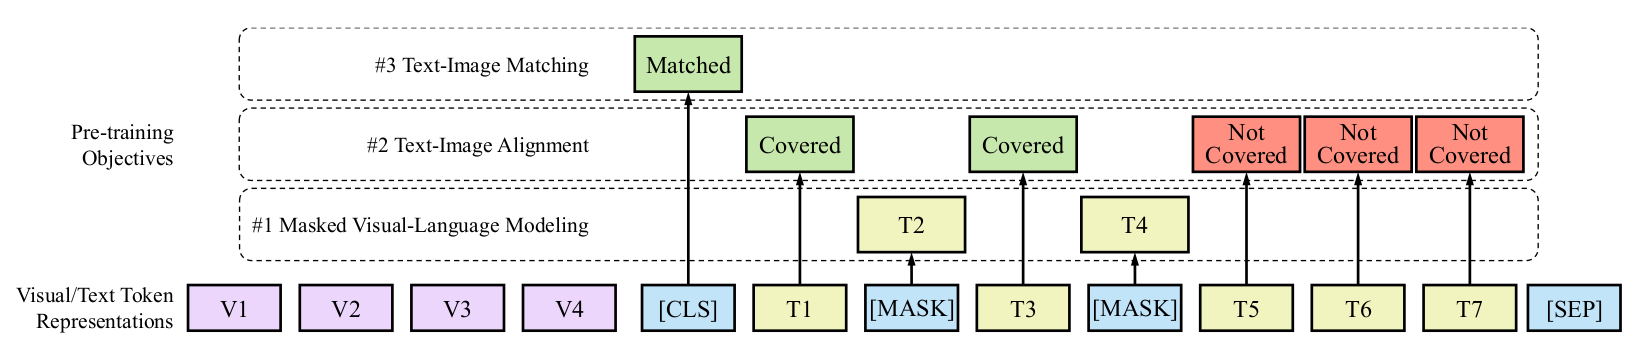
- Pretraining Tasks Although, the Masked Visual Language Model pretraining task was retained, the document classification task was scrapped and in place 2 new training strategies were introduced.
- Text Image Alignment: Randomly the portion in the document image, where a couple of text tokens lie are masked. The objective of the classifier being trained on the encoder outputs is to ascertain, whether the text token is visually present in the entire document image or not.
- Text Image Matching: To gain a more coarse multi modal understanding the alignment task is slightly modified, and this time, the entire document image being fed could be a different page altogether, and the classifier needs to determine, whether the image and text belong to the same page or not.
It must be noted that all these tasks are carried out parallely with a combined loss function to prepare the pretrained model.
Global Table Extractor
Both frameworks introduced till now focussed on improving their pretraining methods so as to be able to perform better on all document AI tasks, not just table detection and extraction. Global Text Extractor (GTE), (Zheng et al, 2021) takes a different approach by focussing on just extracting tables. The core idea behind GTE is to try and find individual cells from tables and relate the structure of the detected cells to one another and eventually identifying the entire table.
Contributions in terms of datasets
-
In the process of the development of such a framework, the authors managed to enhance PubTabNet by adding the cell structure annotations. The HTML version and the PDF version of the same document is matched. The HTML structure gives the logical structure of table cells, while the PDF gives the exact bounding boxes of each word. The combination of the 2 streams of data, therefore are useful in exactly annotating the boundary of each table cell.
-
Tables differ a lot based on domains, and thus to not improve the performance of the GTE framework, a new dataset called FinTabNet was curated. This dataset contains annual reports from S&P 500 companies. Processes similar to the enhanced PubTabNet were used to provide the table and the individual cell bounding boxes.
Architecture
The entire GTE framework is construed by a combination of a few object detectors used in a sequence. The object detection system used here is repplacable, and can be chosen based on convenience. The 2 major components in the framework are GTE Table and GTE Cell that are used for table detection and cell structure recognition respectively.
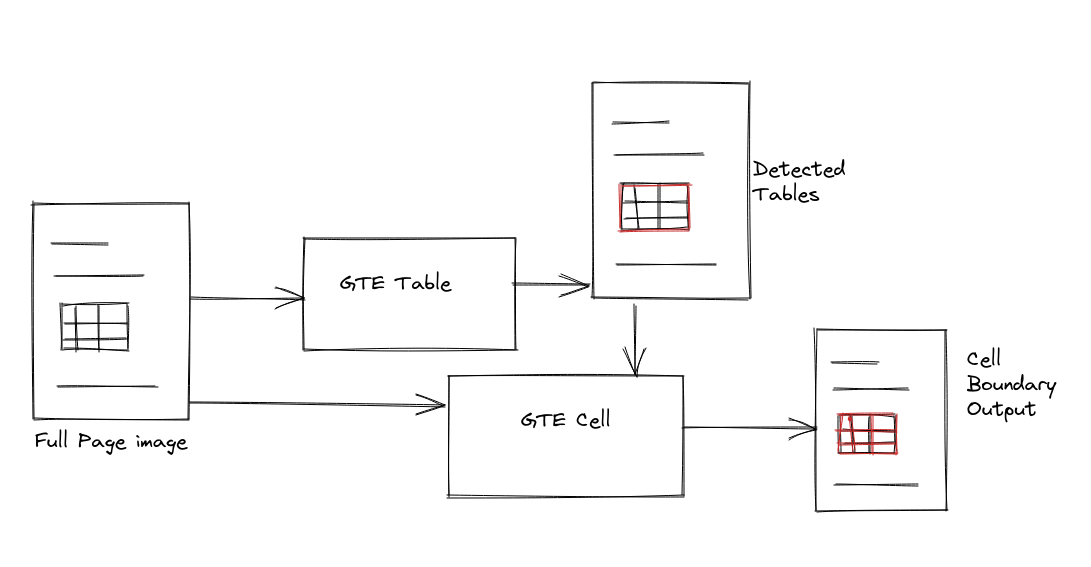
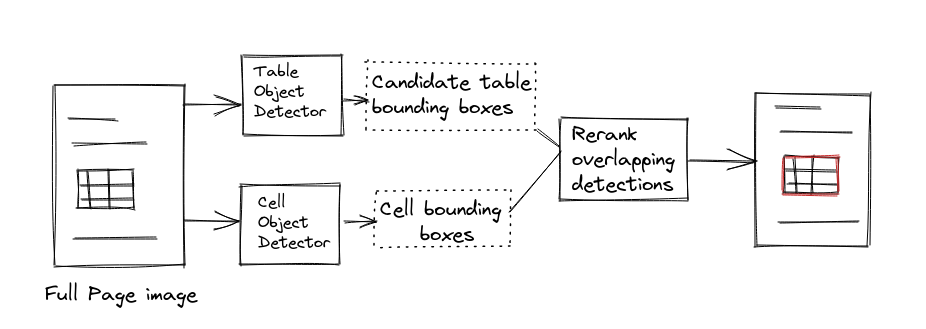
- GTE Table: A object detector trained to find only cells, and another to find tables are run in parallel. It should be noted that the cell detector does so, without the knowledge of the overall bounding boxes of the tables. In addition to the standard loss functions of the individual object detectors, a cell constraint penalty loss function is utilized. This loss function penalizes the outputs of the table detector by comparing the tables detected with the cells produced. A few simple rules dictated by the structure of tables are used to calculate the penalty.
- The percentage of the area covered by the cells inside a table is lower than a threshold.
- Area just inside the table (around the boundary of the table), has too few cells. Since it is rare for the 1st row and columns to be empty in tables
- Area outside the table contains cells.
- The bottom of the table does not have many cells. Absence of enough cells in the final few rows indicate that the table boundary could have been drawn earlier. The hyperparameters used to specify each of the thresholds in these constraint conditions are provided in detail in the Supplementary section of the paper. The final constraint loss function is thereby used to score the table bounding boxes and again, and final predictions are made based on these new rankings.
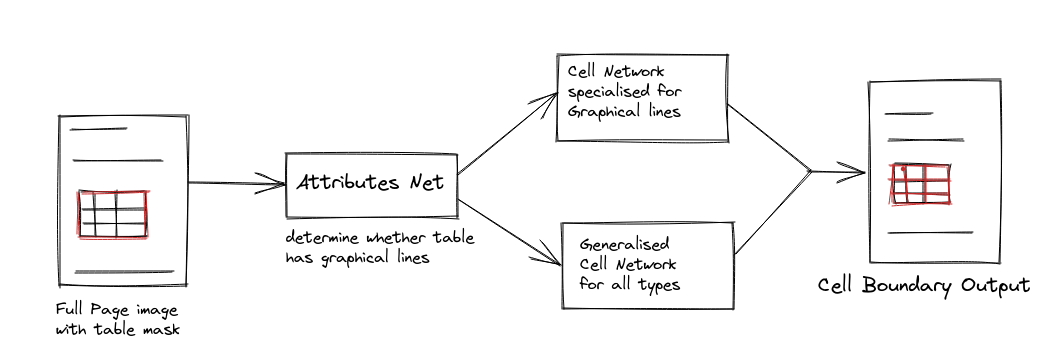
- GTE Cell: The table locations obtained from the output of the GTE Table component is masked in the original full page image that was fed to GTE Table. The masked image is then fed into a network to determine the kind of subsequent cell detection network it should be fed to. In some tables, cells are demarcated based on drawn lines (both horizontal and vertical), while in some cases, the boundaries of the cells are understood, and not explicitly drawn. Therefore, a preliminary check to determine, whether the drawn lines are useful demarcators or not is done by the first network. The output for the cell detectors is then post processed, so that any text box inside the table that did not overlap with any of the cell bounding boxes does not go unassigned.
Note: The performance on individual datasets for all the frameworks mentioned here were state of the art when they were published, and the optimal hyperparameter configurations for each of the tasks are mentioned in detail in the respective papers.